Navigating Rates
China: what’s behind the headlines?

July’s macro data portrayed a sluggish picture of the economic growth outlook in China. Here we look beyond the headlines to provide a more comprehensive assessment of the economy and conclude this is not the “sudden stop” scenario some have suggested.
Key takeaways
- While July’s economic data painted a concerning picture, it showed an ongoing moderation in activity rather than growth spiralling dangerously out of control.
- Last month’s slowdown in credit demand from households and corporates should be seen in the context of a record increase in credit in Q1 2023.
- Despite disappointing versus market expectations, retail sales data across a wide range of sectors remains robust.
- While activity in property-dependent industries such as cement continued deteriorating, other industrial sectors were generally stable.
Economic activity in China was affected by heavy rains and floods in July. Nominal growth rates would also have been distorted by the fall in both producer and consumer prices during the month. Adjusting the retail sales data for consumer price index (CPI) inflation, for example, gives a 0.3% decline in year-on-year (YoY) growth from 3.1% in June to 2.8% in July, compared with the 0.6% YoY decline in nominal terms. Adjusting the growth data for inflation shows July’s YoY rate was slightly above the 1.4% average recorded during the pandemic, whereas in nominal terms the 2.5% YoY rate of expansion was below the average 3.2% rate between 2020 and 2022.
Of course, none of these caveats to July’s economic data should deviate from the fact that economic growth in China remains challenging. But the economic numbers do not indicate a further step down in economic momentum in our view. Rather, this shows a continuation of the trend seen over recent months. The policy response to date also suggests to us that policymakers are responding to what they see as an ongoing moderation in activity, rather than growth spiralling dangerously out of control. Importantly, there is no indication that policymakers intend to pivot away from their drive for “higher quality” growth to the country’s riskier – but more effective – economic model of growth driven by excessive debt and unproductive spending.
Loan growth has been front-loaded and government bond financing will pick up
China’s credit data also painted a concerning picture, as credit demand from both households and companies slowed significantly in July on a YoY basis. The outstanding value of total social financing or TSF – a broad measure of credit and liquidity in the Chinese economy including bank loans, corporate bonds, entrusted loans and trust loans – dropped by RMB 200 billion last month, the first contraction since at least January 2009.
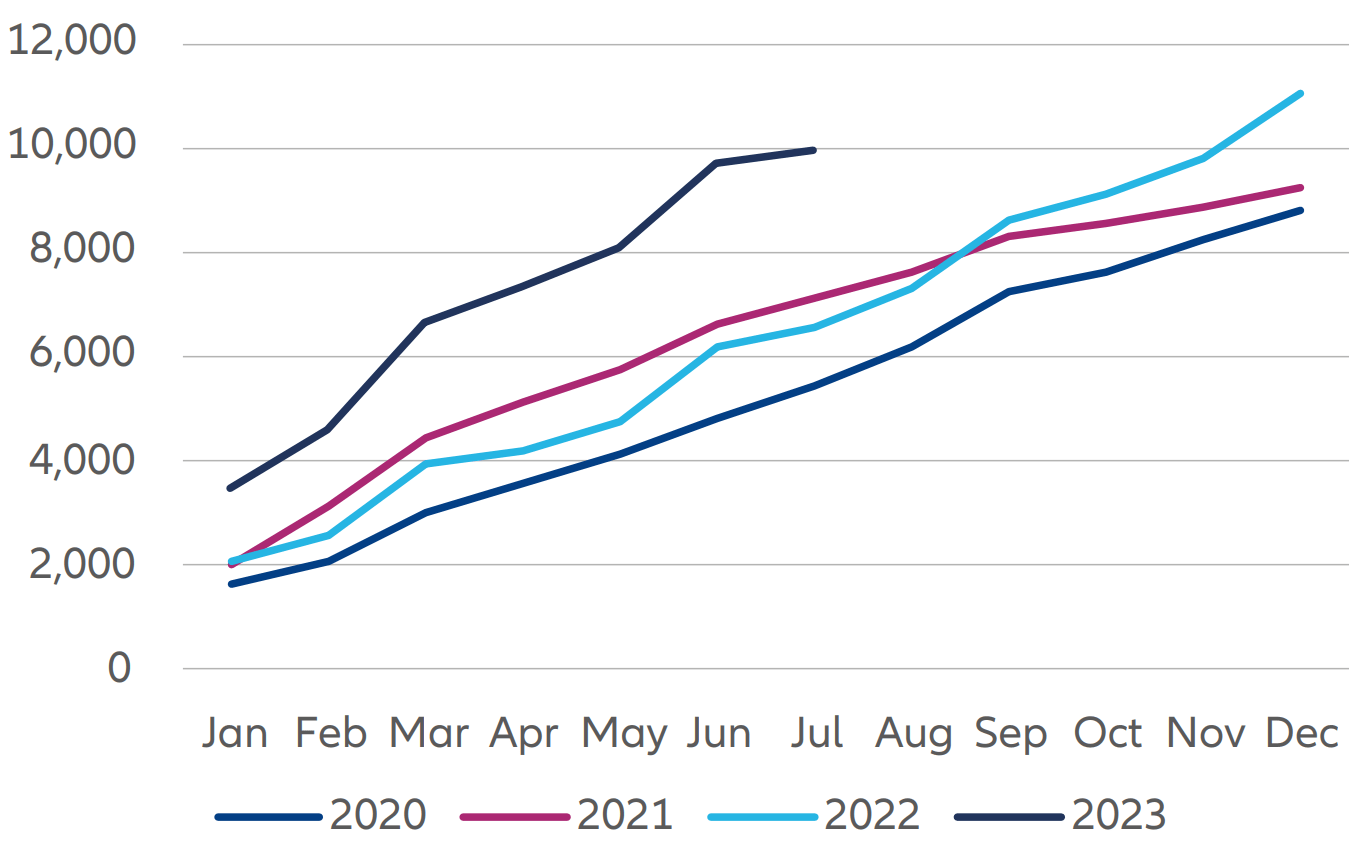
However, this suggestion of a sudden deterioration in China’s borrowing needs is misleading in our view. July’s numbers need to be seen in the context of the trend over previous months. Banks were under pressure from the People’s Bank of China (PBOC) and the government to front-load lending at the start of this year. This resulted in a record increase in credit in Q1 2023, with net new TSF up 20.7% YoY (see Exhibit 1). That lending is now falling from this elevated level should not come as a surprise. Policymakers will likely have been unwilling to boost credit over the rest of the year by expanding banks’ depleted loan quotas for 2023, given that outstanding TSF growth in July 2023 (at 9.2% YoY) was nearly double that of nominal GDP growth (4.9% YoY) – that is despite Beijing’s repeated commitment to keeping total leverage levels in check. Smoothing out those distortions shows a far less concerning trend.
Exhibit 1: China corporates’ credit expansion has been front-loaded in 2023
Corporate LT Loans (YTD, CNY bn)

Source: Wind, Allianz Global Investors as at 31 July 2023
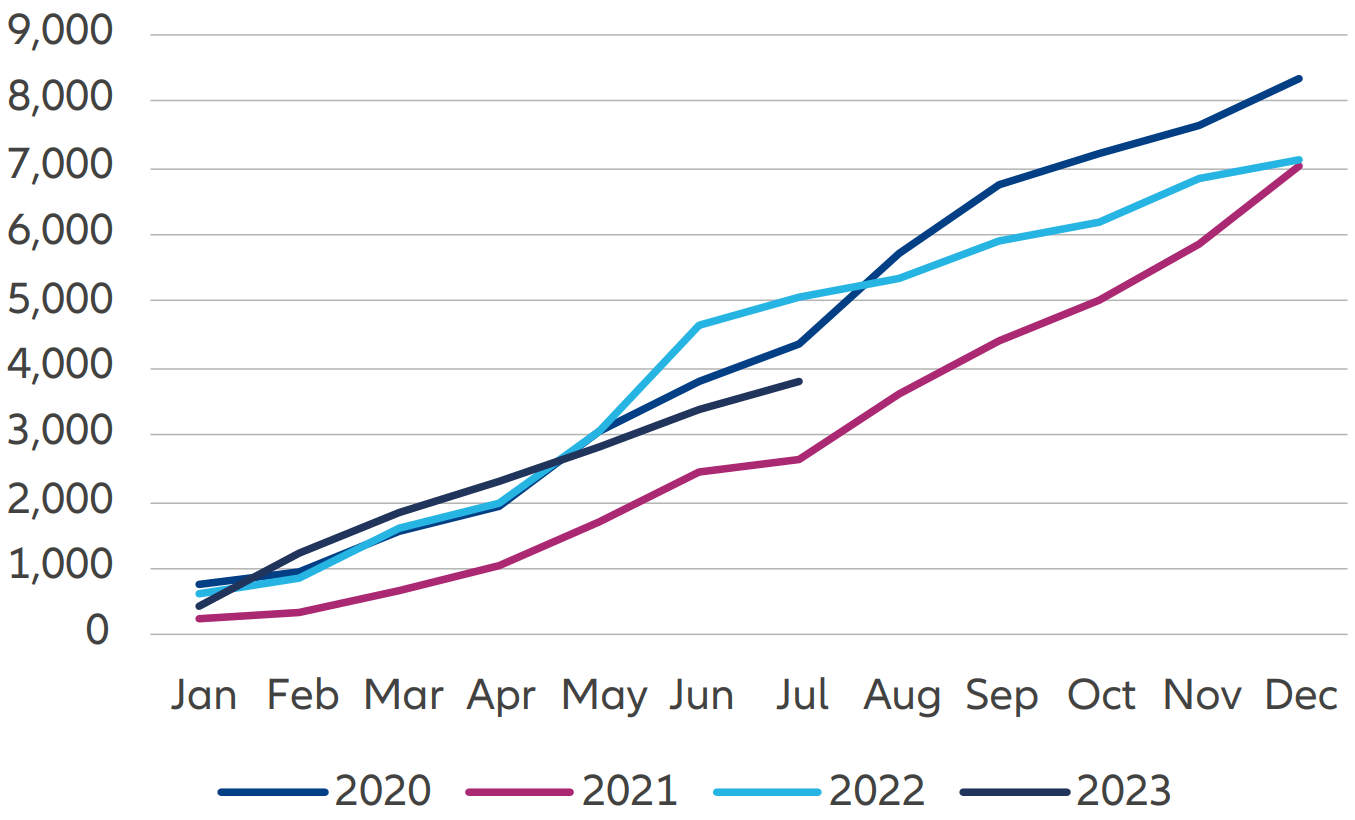
The other important caveat to July’s disappointing credit numbers is that issuance of government debt has been extremely slow so far this year. The large amount of government bonds pending issuance in 2023 means that a baseline of credit demand is baked in for the rest of the year. In reality, it is hard for us to see how government bond financing will remain that weak for the remainder of 2023. Based on the debt issuance plans announced in this year’s budgets, we estimate that net new government bond financing will be at least equal to 2022, if not higher, with upside risk from looser fiscal policy and possible local government debt swaps. Given net new issuance fell 25% YoY in the first seven months of 2023 (see Exhibit 2), this would mean borrowing would need to increase 61% YoY in the final five months of the year to achieve the 2022 level. Even if net new RMB loans continue to fall at the same pace they did in the three months to July (-14.9% YoY) for the rest of this year, which seems unlikely given the low base for comparison in Q4 2023, and even if the net new issuance of government bond financing only manages to match the 2022 level, the outstanding value of TSF would still be up 9.3% YoY for full-year 2023 versus 9.2% YoY growth in July.
Exhibit 2: Government bond issuance is behind trend year-to-date
TSF – Government Bonds (YTD, CNY bn)

Source: Wind, Allianz Global Investors as at 31 July 2023
As with our macro assessment, none of this should detract from the disappointing state of credit demand in China, nor how ineffective June’s rate cut has clearly been at addressing this problem. Full-year credit growth of 9.3% YoY would still be the weakest since at least 2003. However, this is far from the “sudden stop” scenario that the credit data for July superficially appeared to be pointing to.
A wider range of sectors suggest the economy is not out of control
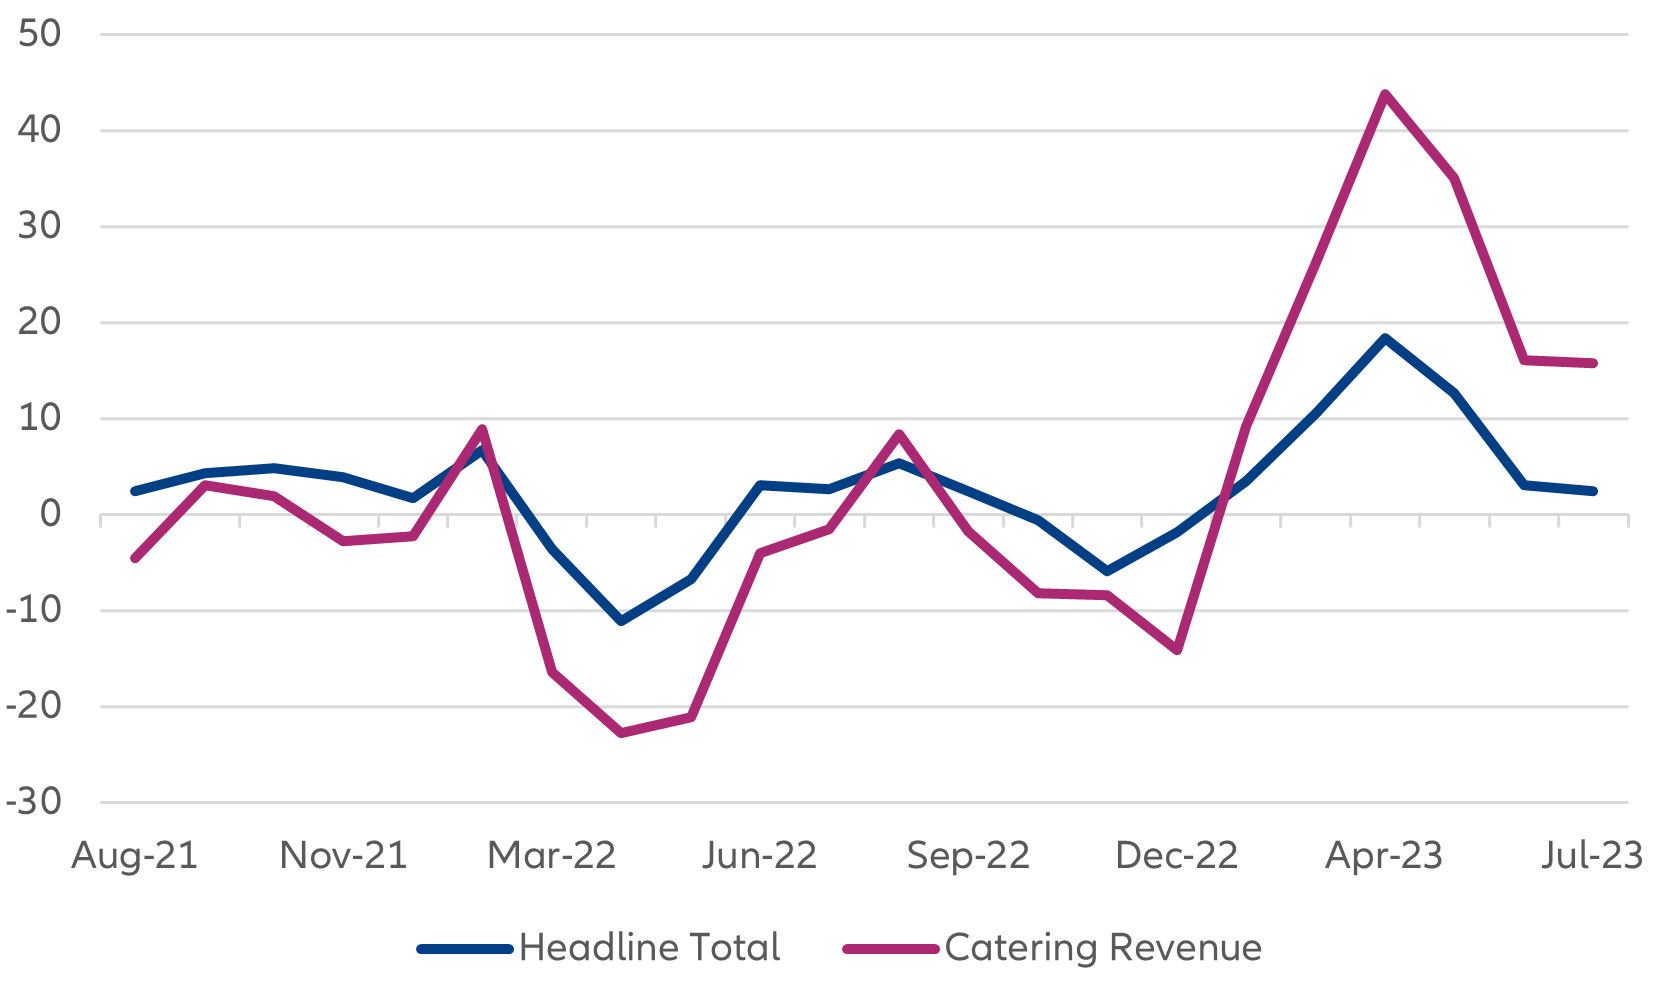
While retail consumption disappointed against market expectations, year-to-date retail sales still rose 7.3% YoY. Catering revenue, often used as an indicator of retail services consumption despite its limited coverage, came in at an elevated 15.8% YoY (see Exhibit 3). China’s National Bureau of Statistics has launched a new indicator, retail sales of services, with a wider coverage of sectors including transport, hospitality, restaurants, entertainment, sports, education and so on. Retail sales of services growth was encouraging at 20.3% YoY year-to-date, far above the headline retail sales figure. Other high-frequency indicators on general mobility and road freight deliveries showed stable activity levels versus June.
Exhibit 3: Retail sales growth remains robust
Retail Sales YoY (%)

Source: Wind, Allianz Global Investors as at 31 July 2023
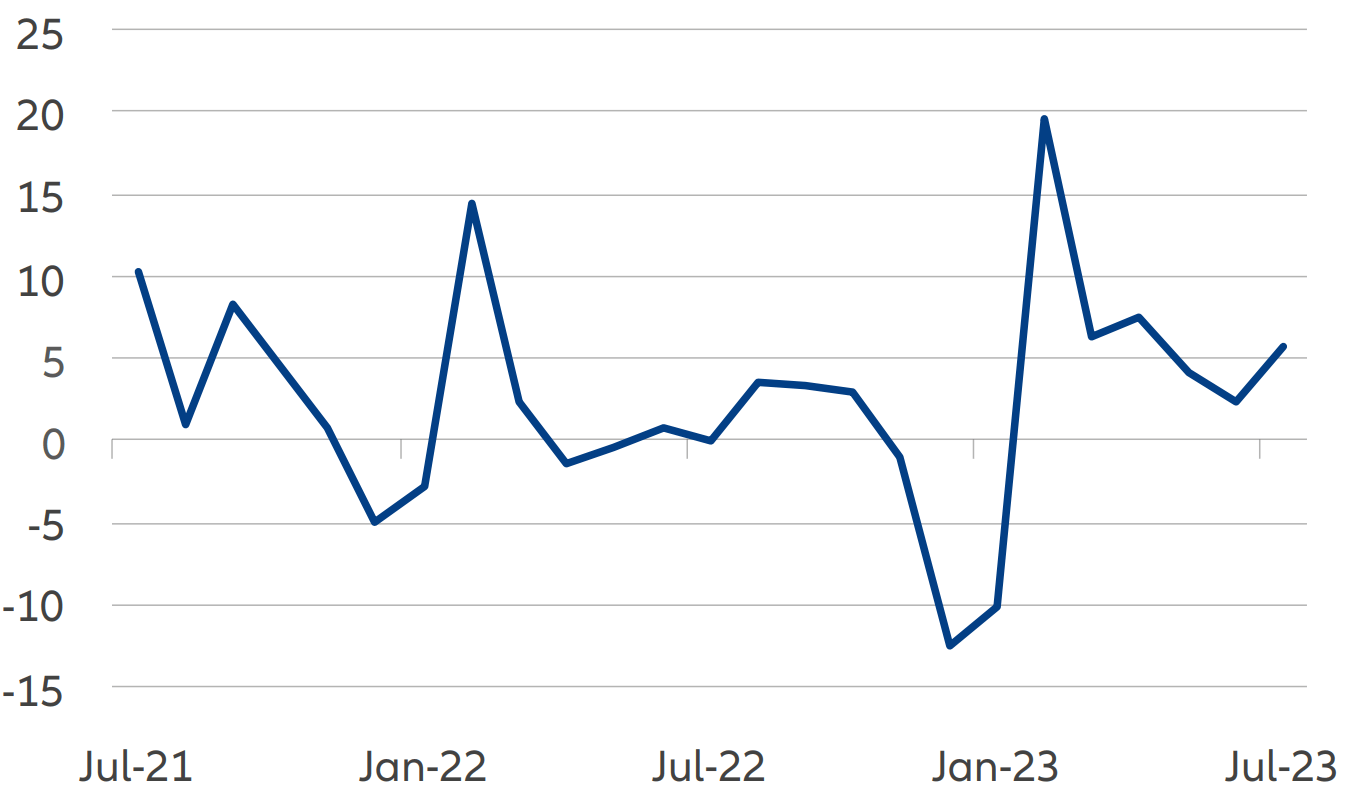
Moreover, while property-dependent industries such as cement continued deteriorating, other industrial sectors were generally stable. Electricity consumption for the secondary industry (which encompasses manufacturing and assembly processes) was 5.7% YoY in July (see Exhibit 4), in line with its trend growth since 2009. Operating rates for coke oven, steel and petroleum asphalt plants have been stable since June, and at similar if not higher levels than 2022. We saw similar trends in containers and bulk carriers’ tonnage unloading in China, suggesting stable demand for consumer goods and raw materials. Lastly, onshore raw material prices bottomed in June and are tracking at higher levels than 2022.
Exhibit 4: Away from property, industrial activity is relatively stable
Secondary Industry Electricity Consumption YoY (%)

Source: Wind, Allianz Global Investors as at 31 July 2023
While growth in home sales and construction activity remained poor last month, which shouldn’t be surprising, the floor space of property completed jumped 33.1% YoY. This suggests progress is being made on delivering pre-sold but unfinished developments, though without generating much in the way of construction activity.


